
The Reports section offers comprehensive historical analytics, enabling merchants, agencies, and stakeholders to track performance trajectories, validate the impact of theme changes, and generate executive summaries.
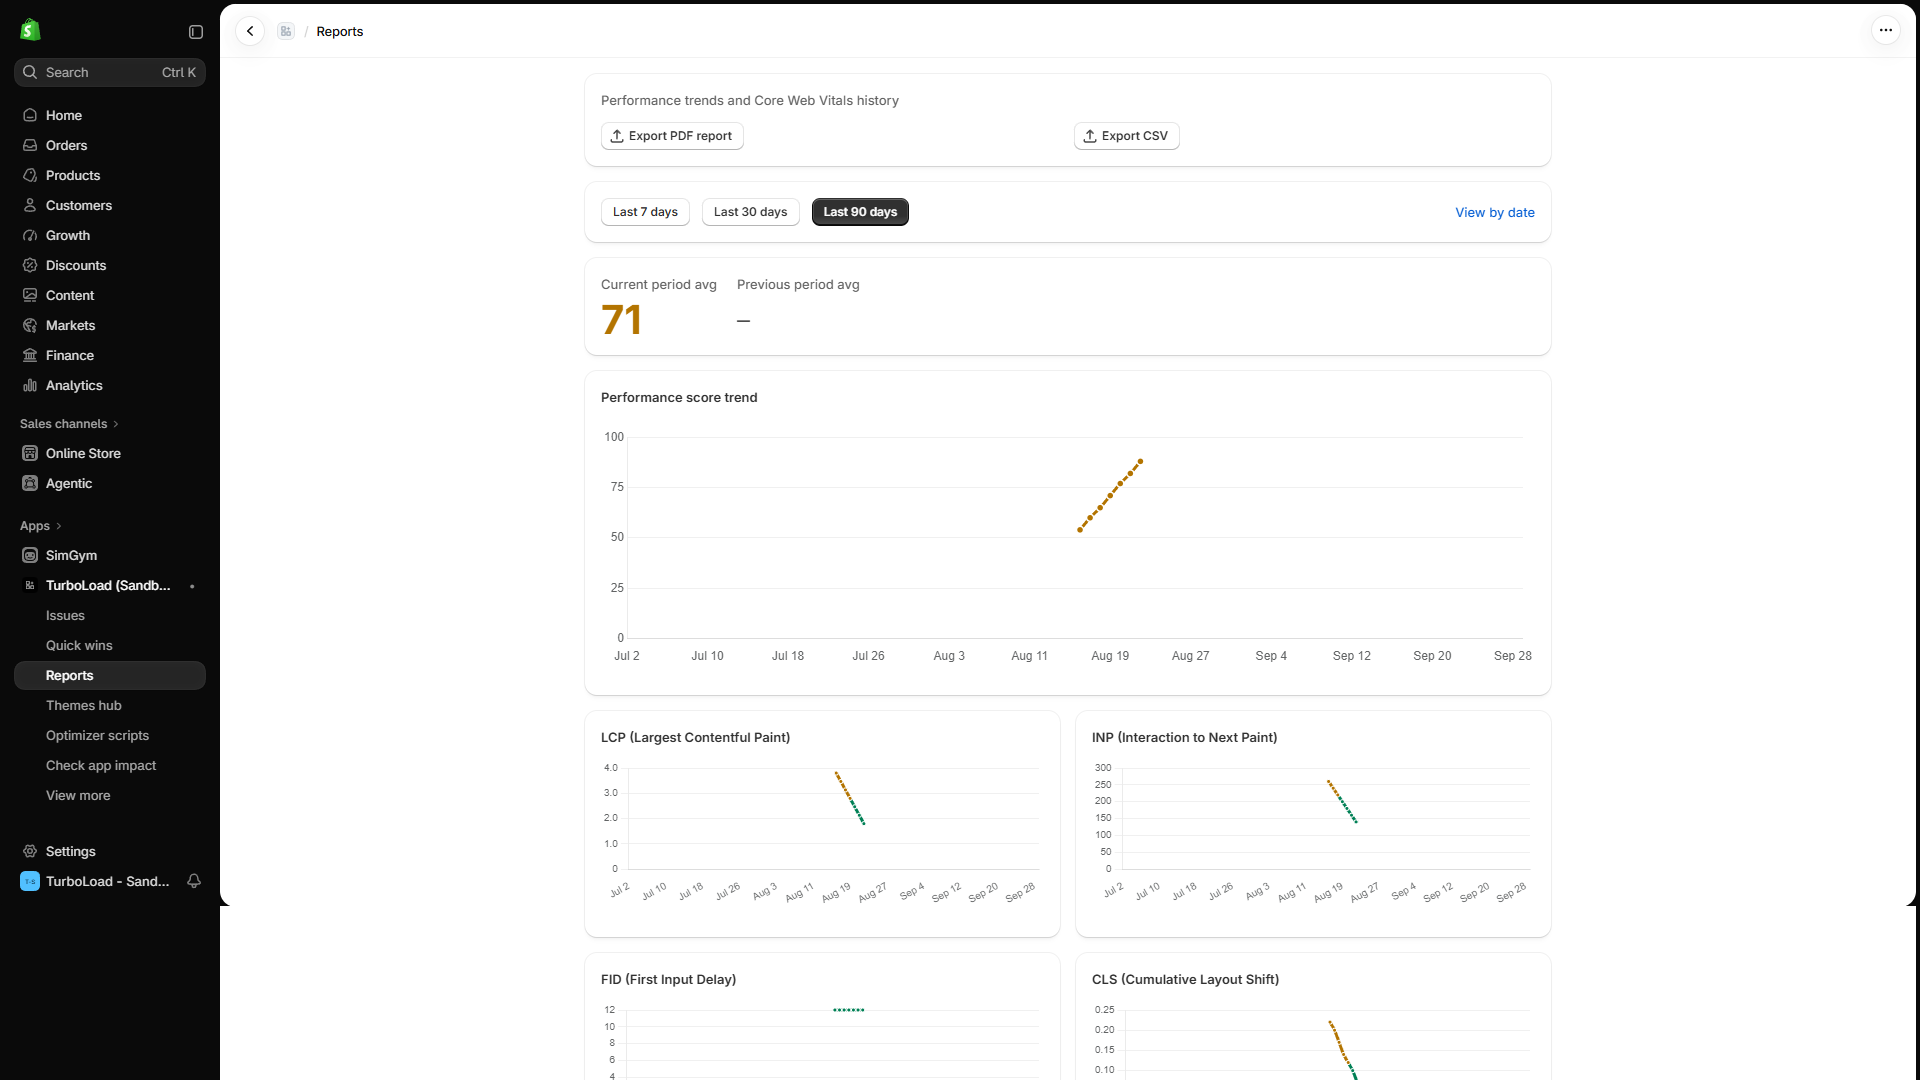
How do I export TurboLoad performance reports? #
To export your store's performance data, navigate to Reports (/app/reports), select your desired timeframe (7, 30, or 90 days), and click either Export PDF for an executive, multi-page presentation or Export CSV for raw tabular data. Exports download instantly to your computer with zero configuration required.
Exploring Historical Performance #
1. Flexible Timeframe Selection #
At the top of the Reports page (/app/reports), toggle between preset reporting windows:
- Last 7 Days: Ideal for monitoring immediate regressions following a recent marketing campaign or app install.
- Last 30 Days: The standard benchmark period matching Google's rolling Core Web Vitals assessment window.
- Last 90 Days: Long-term seasonal comparison (e.g. comparing Q3 baseline against Q4 holiday peak).
2. Metric Breakdown & Device Segmentation #
Reports dissect your performance data across multiple dimensions:
- Device Type: Mobile vs. Desktop comparison. Mobile traffic represents 70%+ of Shopify shoppers and is evaluated most heavily by Google.
- Core Metrics: Daily averages and 75th percentile (p75) values for LCP, INP, CLS, and TTFB.
- Page Views & Traffic Volume: Correlate speed metrics with traffic surges.
Standardized Report Exports #
TurboLoad makes it simple to download and share performance records across your organization with canonical standardized exports:
1. Tabular CSV Export (.csv)
#
- Download Action: Click Export CSV in the top action bar.
- File Name Format:
turboload-report-<period>.csv(orturboload-report-<dateKey>.csvfor single-day reports). - Contents: Clean, unformatted tabular data containing timestamps, scores, page views, and millisecond values for all Core Web Vitals.
- Use Case: Direct ingestion into Microsoft Excel, Google Sheets, PowerBI, or Tableau for internal analytics.
2. Executive PDF Report (.pdf)
#
- Download Action: Click Export PDF in the top action bar.
- File Name Format:
turboload-report-<period>.pdf. - Contents: Beautifully styled, presentation-ready multi-page PDF including visual score rings, trend graphs, app attribution summaries, and prioritized recommendations.
- Use Case: Executive briefings for store founders, board members, or client presentations by Shopify partner agencies.
Automated Executive Reporting & Agency Sharing #
Designed for both independent brand owners and full-service eCommerce agencies:
- Client Presentation Ready: Clean, branded PDF deliverables eliminate the need to manually build monthly speed decks.
- Audit Trails: Historical exports provide immutable proof of speed improvements achieved over time.
- Secure On-Demand Access: Team members with Shopify Admin permissions can export reports at any time.